Pedestrian frequencies - sensors and the vibrancy of the city
How sensors for measuring pedestrian traffic contribute to the "revitalization of city centers”.
How can one measure whether a city center is "vibrant"?
The indicator of the attractiveness and vibrancy of a city center is the frequency of visitors,meaning the number of people who spend time in the city center or its sub-areas.
So far, traditional traffic counts were utilized to gauge pedestrian frequency. This normally entails manual tallying of pedestrian traffic at various locations on "typical" days. Typical days for this purpose are Tuesdays (sometimes Thursdays) and Saturdays, which are particularly relevant for the retail. It is important to avoid special occasions such as school holidays, weeks with public holidays or the pre-Christmas season. The results should generally reflect the “normal circumstances”. This results in a very narrow focus. Other influencing factors such as holidays, school holidays, weather, events, or seasons are not taken into account.
Sensor-based measurement of pedestrian frequencies
In the current digital age, manual counts with clipboards and tally sheets are mostly a thing of the past. Now, modern sensor technology enables 24/7 anonymous and precise measurement of pedestrian frequencies, while complying with data protection regulations. In Munich's city center, the provider hystreet.com operates a sensor infrastructure which uses laser scanners to provide meaningful and reliable measured data for eight sections of Munich's pedestrian zones (Kaufingerstreet, Maximilianstreeet, Neuhauser Street East, Neuhauser Street West, Schützenstreet, Sendlinger Street, Valley and Theatinerstreet).
In addition to mere counting, the laser scanners are able to determine the direction in which passers-by are walking and also distinguish between children and adults. Personal data is not collected using this method, and walking routes are not tracked.
Additionally, meteorological data for the location is recorded for each measured value, providing valuable additional context.
The goal was to provide the city administration with processed measurement data in order to facilitate the use of the data as an analysis and evaluation tool for the revitalization of the city center.
Data workflows and sensor data infrastructure
Sensors continuously record new measured values. In the case of pedestrian data, quarter-hourly values are available. This data must first be fully automatically integrated, strucutred and historicized via an API. In addition to the current measured values, long-term analyses and the determination of individual reference values are also possible - for example for relevant durations, locations or weather conditions. The FROST® server is used for this purpose, with which data can be provided via the standardized "OGC SensorThings API".
Data visualization and analysis in pedestrian frequency dashboards

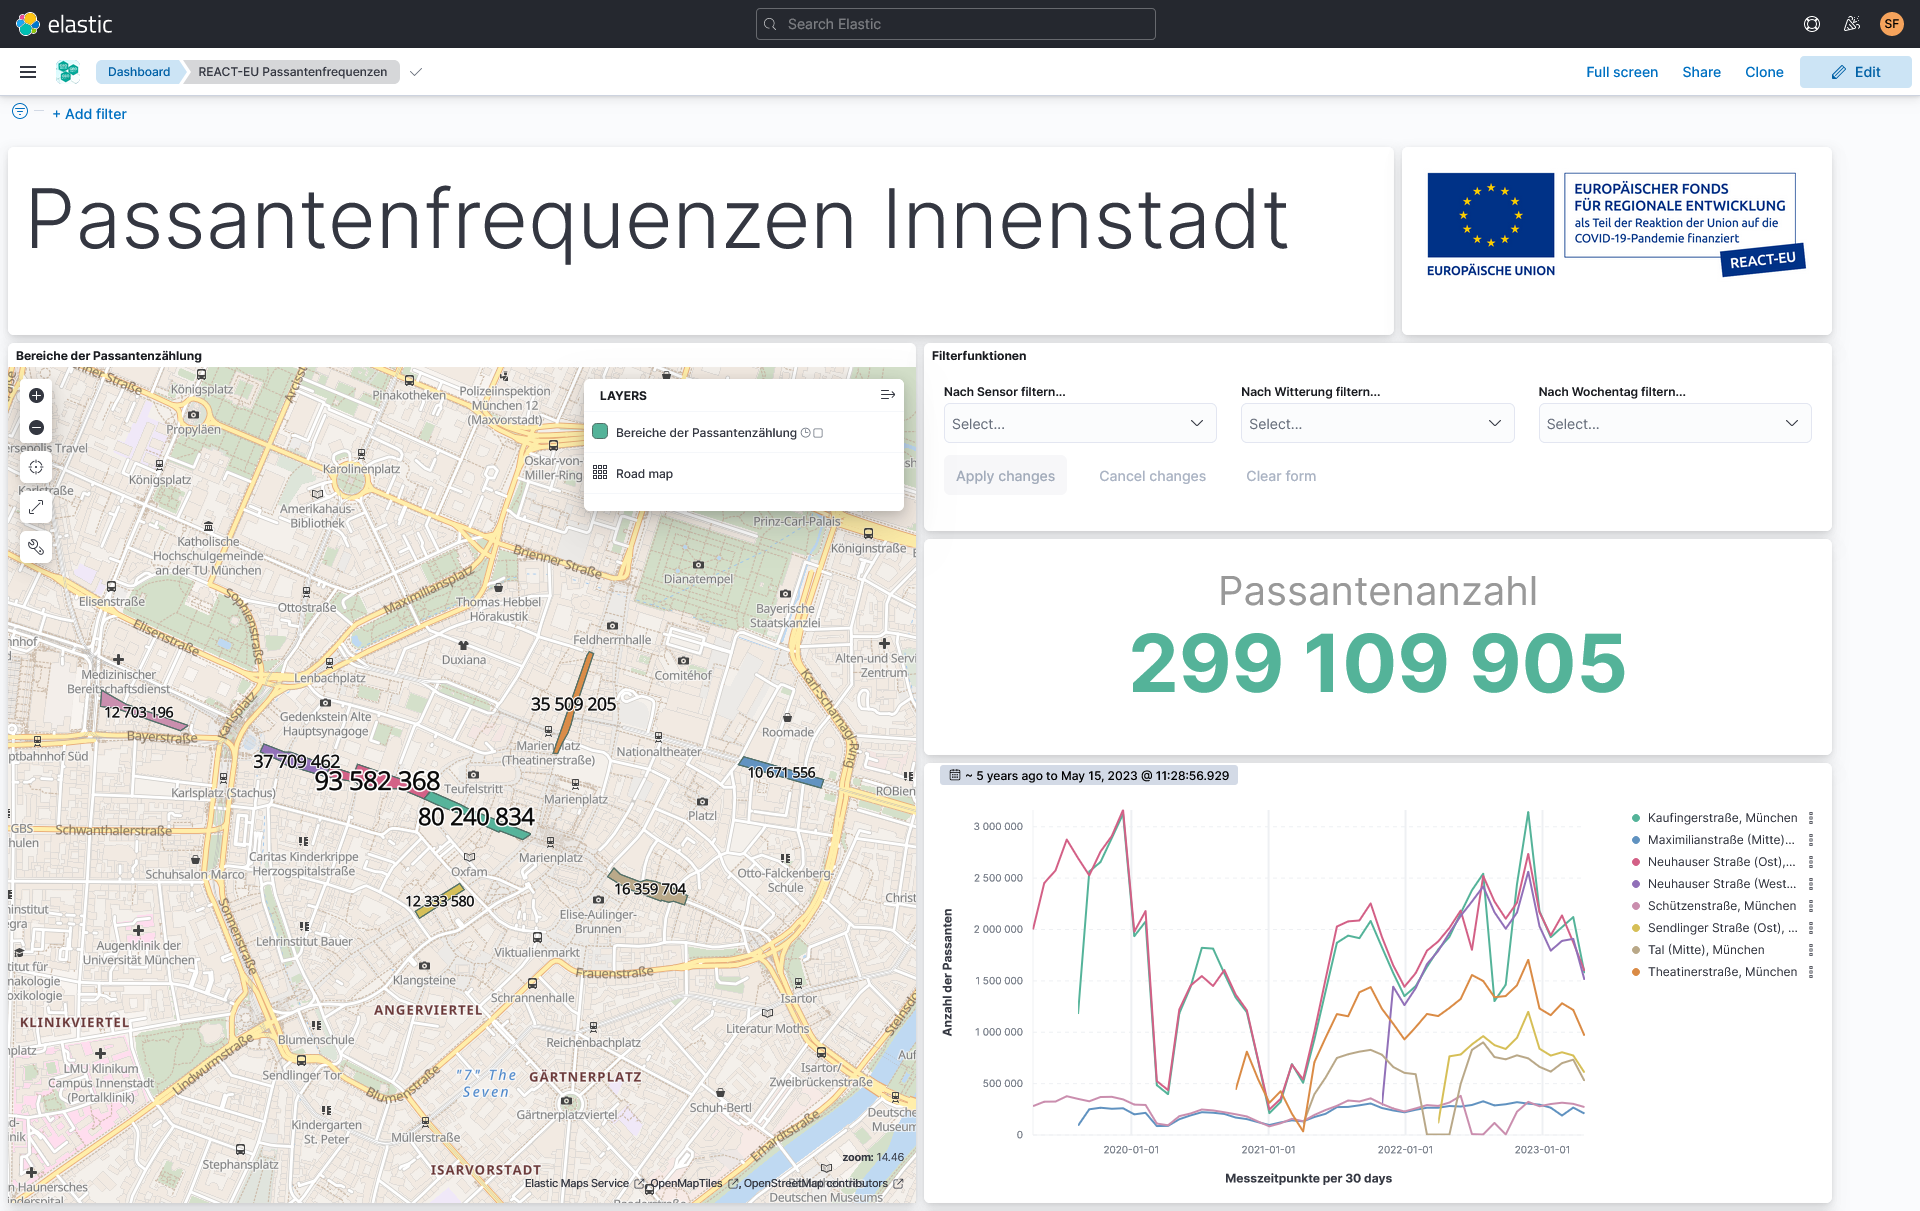
For the evaluation of pedestrian count data, functionality and visual appearance then come into focus. Various requirements were defined during the analysis of the use cases. Four functions are highlighted in particular: Display of geoinformation on maps, extensive filter functions, temporal and spatial comparison functions and historicized storage of measurement data.
The specialist users receive the data via an interactive dashboard with diagrams and tables. As the locations of the sensors are of great importance, cartographic representations are also a must. Kibana, an open source solution, was chosen as the dashboard software.
Filters and the importance of historicized data
The dashboard allows for the city administration's specialist departments to filter pedestrian flows for example by pedestrian zone, day of the week or weather conditions. If required, individual components or the entire dashboard can be limited to a specific observation period.
The historicized data is of particular importance in this regard. While the focus here is less on the current management of pedestrian traffic, the focus is on aspects of urban development or business development. This means that it must be possible to carry out analyses over longer periods of time as well as narrow time windows - and over a period of years. As an example, the count values can be compared with each other within an individually selectable period in order to evaluate changes compared to the previous year or the previous week, accordingly. For instance, it clearly shows the slump in footfall within the city center at the peak of the Covid-19 pandemic. However, the impact of events from the city's birthday to the European Football Championship can also be monitored.
The influence of the weather
Another particularly valuable feature is that the system can determine meaningful reference values, for example based on weather or time. While the weather has a major influence on the results of long-term planned counts with the clipboard, the sensors are always operating. This means that important framework parameters can be taken into account during analyses and the significance of the results is significantly increased.
For every measured value of pedestrian frequency, tempurature data and weather conditions are therefore also stored and are available as filter and analysis functions within the dashboards. For example, pedestrian numbers can be specifically evaluated depending on the temperature, weather conditions and time of day.
Sensors and the revitalization of the city center
The connection of sensor data on pedestrian frequency in the city centre, its historicization and preparation in a dashboard offers an essential analysis and evaluation tool for the revitalization of the city centre. The information, which was developed as part of the REACT-EU funding project and made accessible via the Digital Twin Munich, enables a long-term analysis of the development of pedestrian frequencies at relevant inner-city locations. This includes long-term monitoring to identify the need for action as well as an indication to measure the effectiveness of measures to revitalize the city centre.
An article of:
Alexander Mayr, Johannes Krämer and Sebastian Freller
GeodataService Munich, City of Munich


